All your daily tracking is now centralised in a single Dashboard tab, featuring three clear, actionable views.
Goal: Quickly provide you with the key indicators needed for faster decision-making and more effective management.
1. Revenue

Filter by category or drill down into product subcategories (e.g., double vs. twin rooms) to see exactly what is driving growth.

Compare performance with last year and use the Quantity view to determine whether revenue growth is driven by increased volume (e.g., rooms sold) or pricing shifts—perfect for swiftly refining and adapting your strategy 🙂.

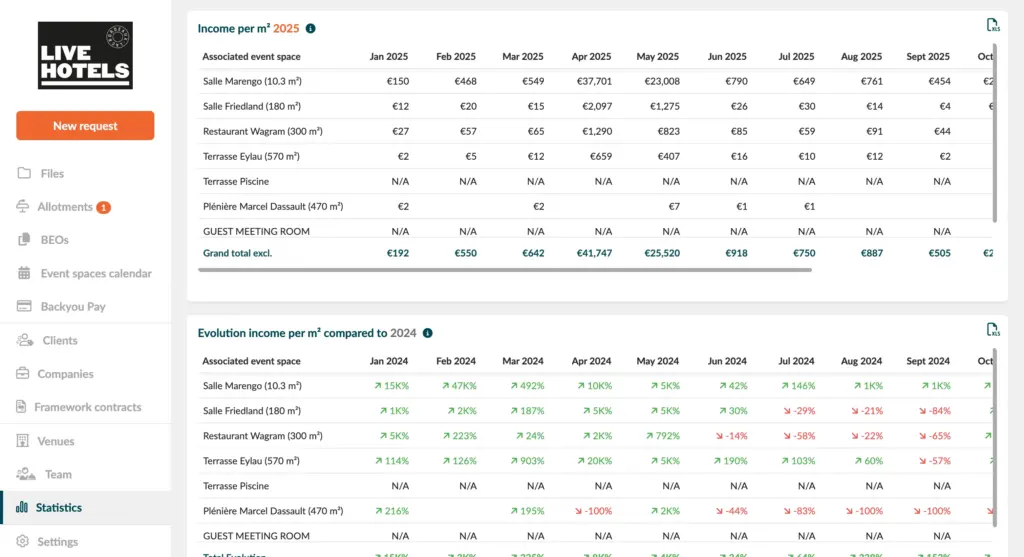
2. Event Space
Track occupancy by time slot (morning, lunch, afternoon, evening), identify peak and slow days, and adjust pricing accordingly—applying effective revenue management to your spaces.
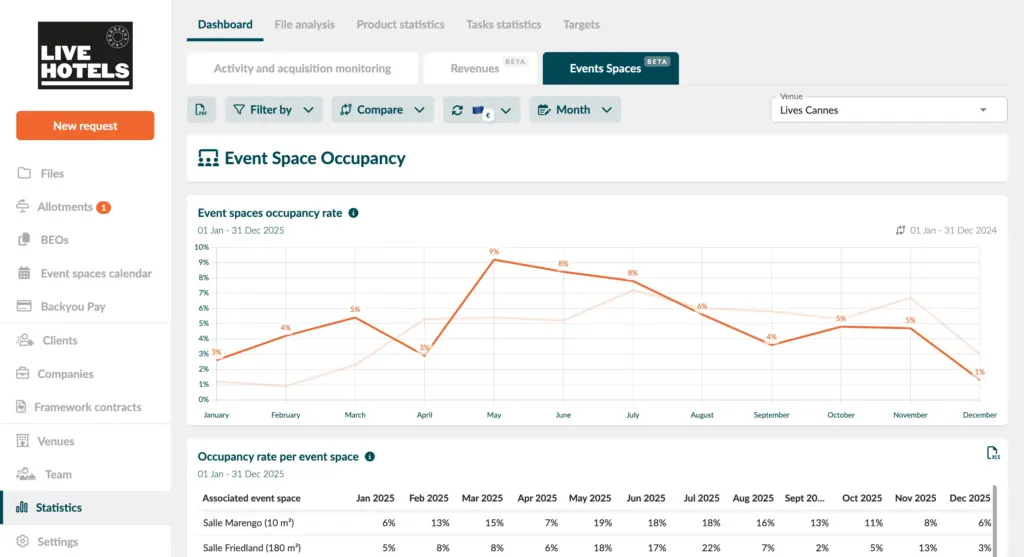
See revenue by room and outdoor spaces; use the ‘Income per square meter’ metric for a clearer picture of your total room revenue.
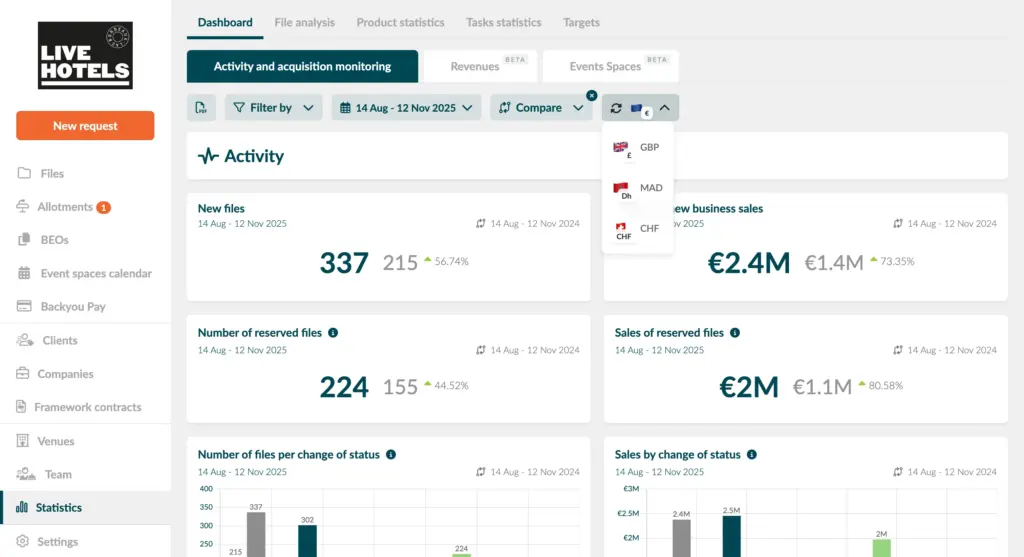
3. Activity & Conversion
Keep a full overview of your requests, proposals, conversions, and reasons for refusals — no exports or manual work needed.
Bonus for Multi-Country Use: All reports handle multiple currencies and convert to a reference currency for international groups.